35% off your first month · Use code SUMMER26
Indicators Guides How it works Mentorship My Account View Indicators →
Indicator Guides

Learn the tools.
Trade with confidence.

A full breakdown of every 4TL indicator, what each signal and confluence means, and exactly how to read them on your chart. New to the indicators or just want to get more out of them? Start here.

4TL Algo 4TL ORB 4TL ICT
FLAGSHIP

4TL Algo

The 4TL Algo is our flagship all-in-one system. It weighs trend, momentum and market structure into a single clear Buy or Sell call, colors your candles by trend, and plots your entry, stop loss and take-profit targets automatically. Below is every piece of the Algo and how to use it.
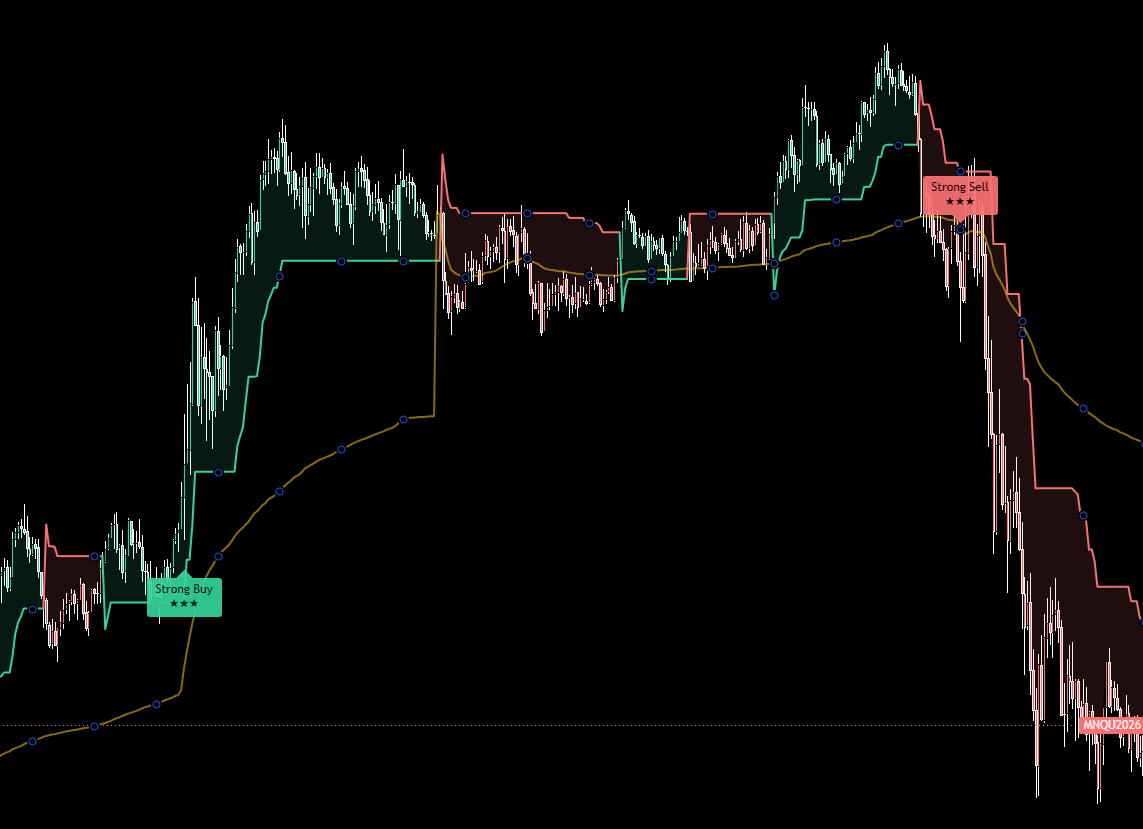
4TL Algo Buy and Sell signals
01 · CORE SIGNAL

Buy & Sell Signals

The Algo fires a Buy or Sell label the moment its weighted conditions line up. Instead of one indicator telling you to go long while another says short, the Algo blends trend, momentum and structure into one honest call so you are not stuck second-guessing.

Each signal comes with a strength rating so you instantly know how much confluence is behind it, from a weak setup to a high-conviction one.
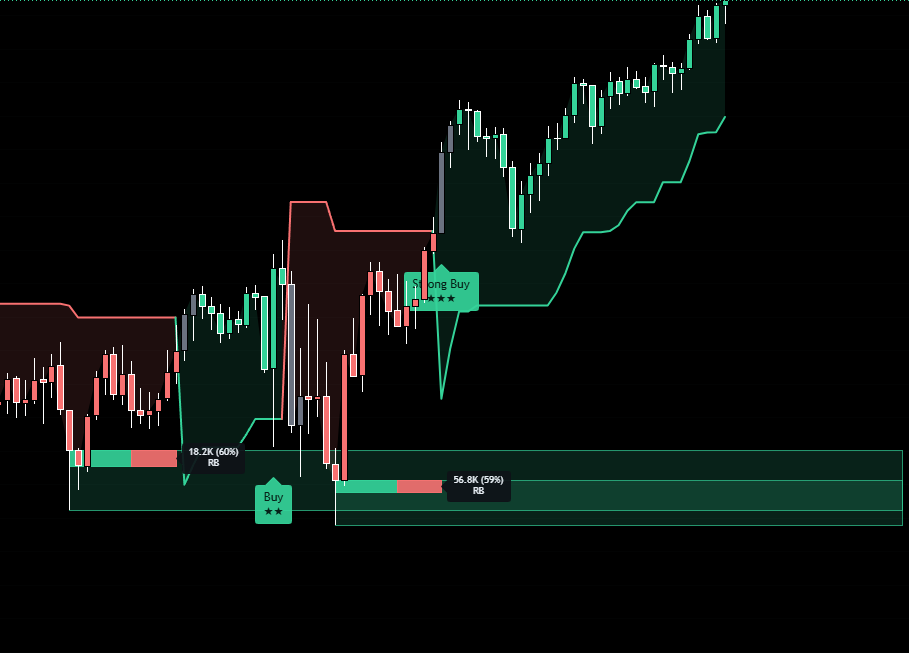
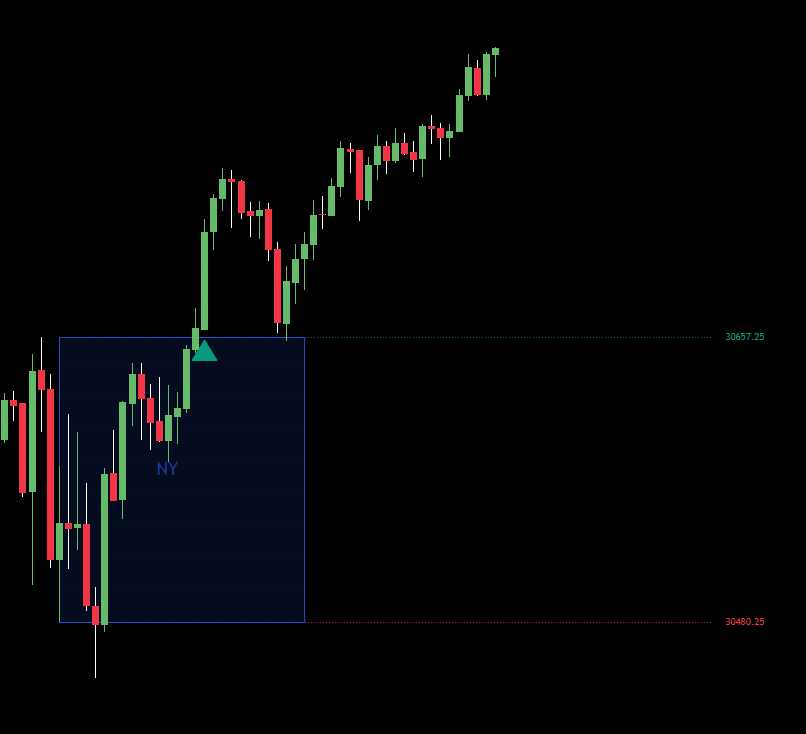
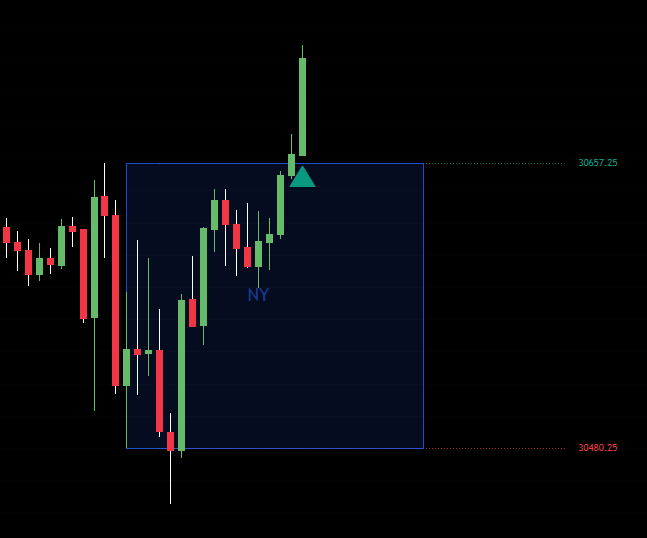
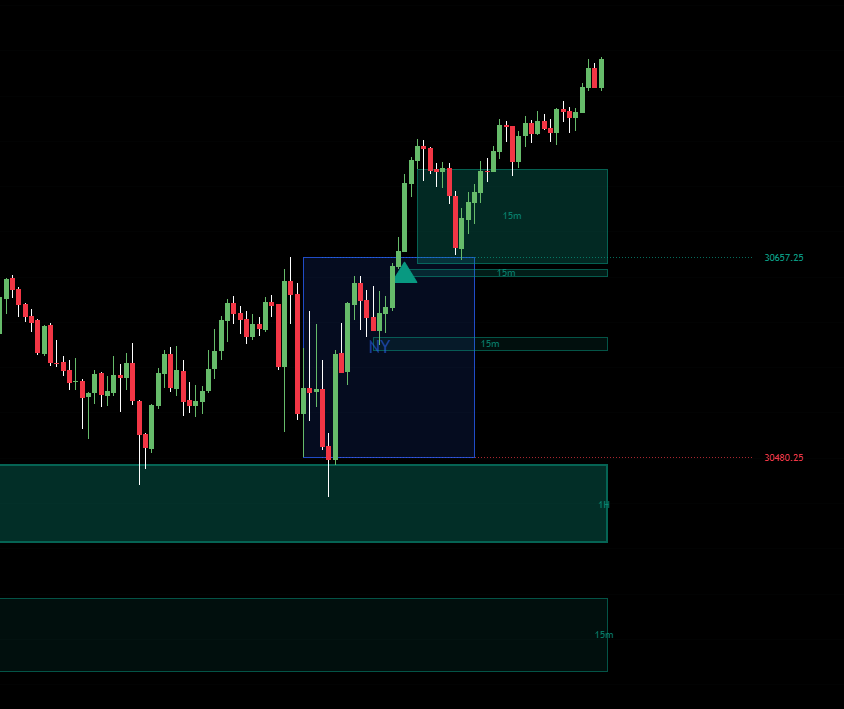
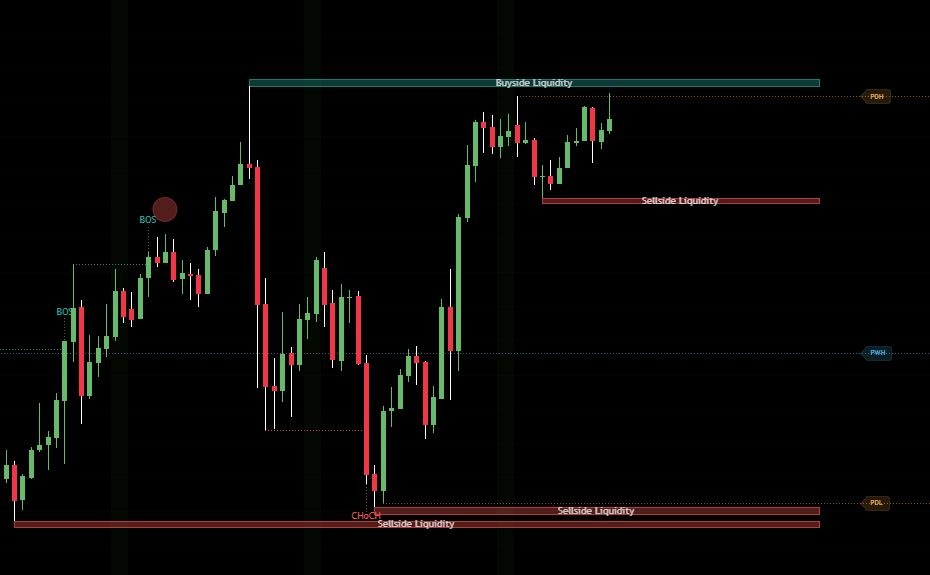
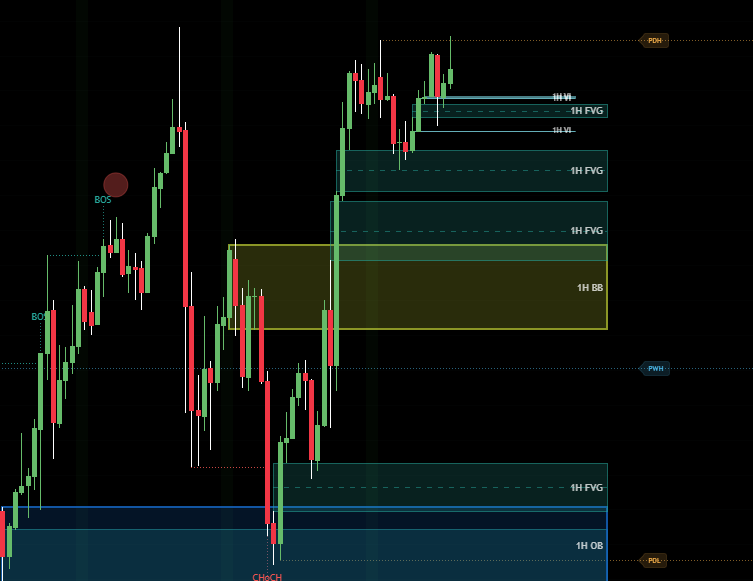
Higher strength ratings mean more conditions agreed. Treat low-strength signals as lower priority, especially against the higher timeframe trend.
4TL Algo rejection blocks
02 · NEW

Rejection Blocks

Rejection blocks mark the zones where price was firmly rejected and smart money stepped in. These are the areas where the market has already shown it does not want to trade, so they often act as strong support and resistance going forward.

Use them to time your entries and to know where price is likely to react. A signal that fires near a fresh rejection block carries more weight than one in open space.

When price returns to a rejection block, watch for the Algo to confirm direction before you act. The block tells you where, the signal tells you when.
4TL Algo trend-colored candles
03 · TREND

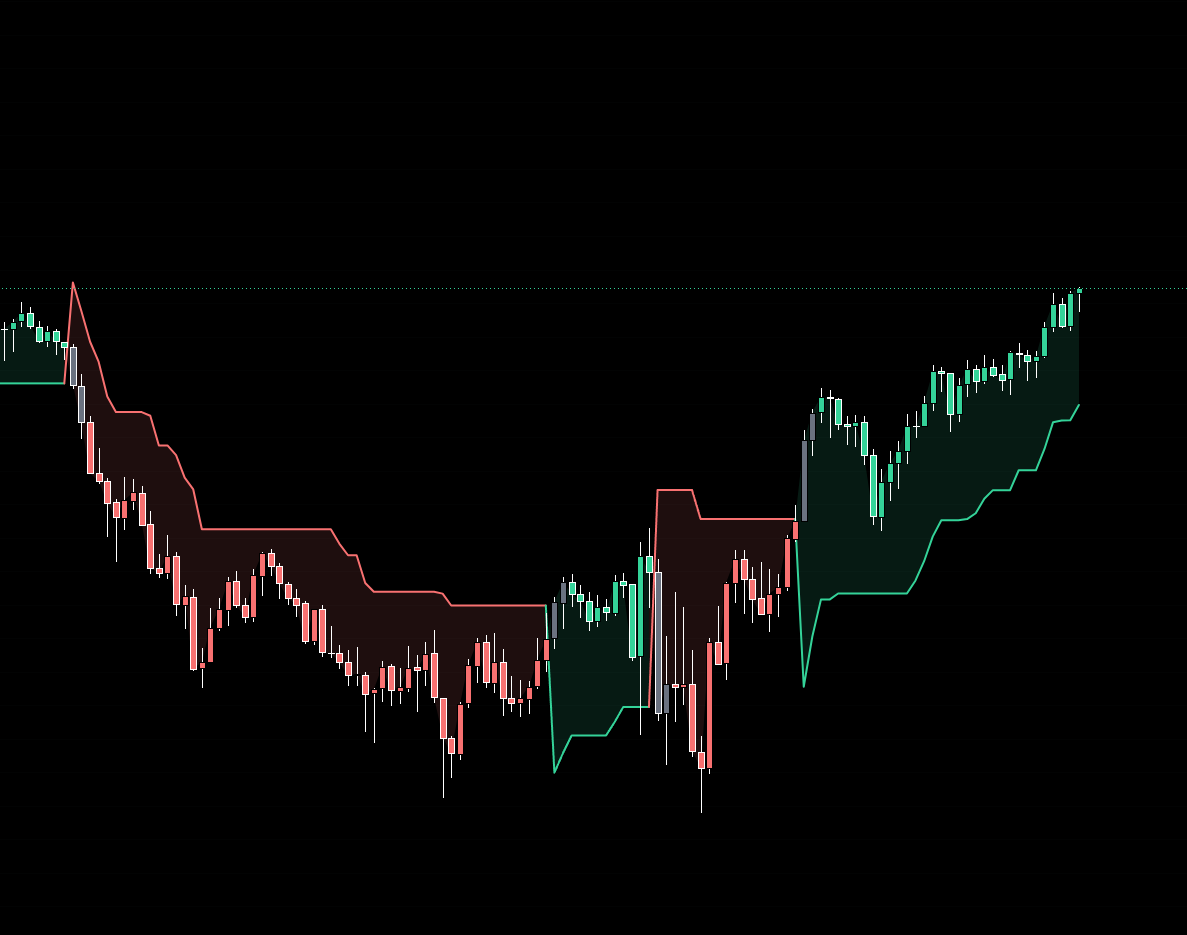
Trend-Colored Candles

Your candles are automatically colored by the current trend, so you can read direction at a glance without staring at moving averages. Green-state candles mean the system reads bullish conditions, red-state means bearish.

This keeps you on the right side of the move. The cleanest trades are usually the ones where your signal agrees with the candle color and the higher-timeframe dashboard.

Trade with the candle color, not against it. A Buy signal while candles are in their bullish state is far higher quality than one fighting a red trend.
4TL Algo multi-timeframe dashboard
04 · CONFLUENCE

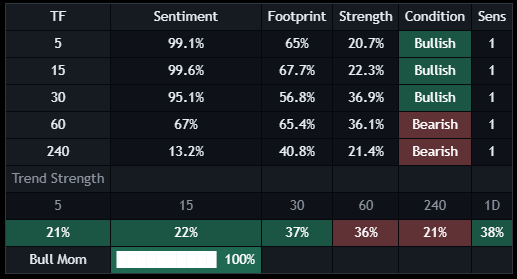
Live Multi-Timeframe Dashboard

The on-chart dashboard shows you the trend and sentiment across multiple timeframes at once, all in real time. It keeps you aligned with the higher timeframe so you are not taking a 5-minute long into a 1-hour downtrend.

Use it as your final filter. When the dashboard, the candle color and the signal all agree, that is your A+ setup.

Green across the higher timeframes and a Buy signal? That is alignment. Mixed dashboard? Size down or wait for cleaner agreement.

Putting it together

1

Check the dashboard

Confirm the higher-timeframe trend before anything. Trade in its direction.

2

Wait for a signal

Let the Algo fire a Buy or Sell with a solid strength rating, ideally near a rejection block.

3

Confirm the trend

Candle color should agree with your signal direction. Skip the ones that fight the trend.

4

Execute with confidence

Enter in the signal direction with the trend and dashboard behind you, and manage your trade.

Ready to run the Algo? 35% off your first month with code SUMMER26.
Get the Algo
ORB

4TL ORB Indicator

The 4TL ORB indicator trades the Opening Range Breakout. It auto-plots the opening range for every session, waits for a confirmed break, and highlights the imbalance zones price wants to fill. Built for traders who want a clean, rules-based session strategy.

4TL ORB opening range
01 · THE RANGE

Auto Opening Range

The indicator automatically marks the opening range for every session, London, New York and more, the moment it forms. This is the high and low that price establishes early in the session, and it becomes the battleground for the breakout.

No manual drawing. The range is plotted for you the same way every session so your strategy stays consistent.

The range high and low are your key levels. Everything in the ORB strategy keys off a break of one of these edges.
4TL ORB confirmed break signal
02 · THE SIGNAL

Confirmed Break Signals

The ORB waits for a candle to close outside the range before it signals, instead of reacting to every wick that pokes through. When a break is confirmed, you get a clear LONG or SHORT call telling you which way price committed.

Because it waits for the close, it filters out the fake-outs that trap breakout traders. No repainting.

Patience pays here. A wick through the range is not a signal. Wait for the confirmed break the indicator marks for you.
4TL ORB imbalance zones
03 · TARGETS

Multi-Timeframe Imbalance Zones

The ORB highlights price imbalances across the 15m, 30m and 1H timeframes, the areas where price moved too fast and left a gap that often gets revisited. These zones show you where price is likely to be drawn.

Use them as targets and reaction areas after a break. Price breaking the range and heading into an unfilled imbalance is a clean, logical trade.

Line up a confirmed break heading toward an imbalance zone on the higher timeframe. That is where the highest-probability ORB trades come from.

Putting it together

1

Let the range form

Wait for the session opening range to plot. Do not pre-empt it.

2

Wait for the close

Only act on a confirmed LONG or SHORT break, not a wick poke.

3

Find the target

Look for an imbalance zone in the break direction to aim for.

4

Manage risk

Stop on the other side of the range edge, take profit into the imbalance.

Want the ORB on your charts? 35% off your first month with code SUMMER26.
Get the ORB
ICT

4TL ICT Indicator

The 4TL ICT indicator packs the complete ICT model into one tool: market structure, liquidity, order blocks, fair value gaps, SMT divergence and killzones. Everything the smart-money trader watches, auto-detected and marked on your chart.

4TL ICT market structure
01 · STRUCTURE

Market Structure

The indicator maps market structure for you, marking breaks of structure (BOS) and changes of character (CHoCH). This is the foundation of the ICT model, it tells you whether the market is trending or about to shift.

Read it to know the bias. You want to be trading in the direction of structure until a change of character warns you the move is done.

A CHoCH against the prior trend is your early warning. A BOS in the trend direction confirms continuation.
4TL ICT liquidity
02 · LIQUIDITY

Liquidity Levels

The tool marks the liquidity resting above highs and below lows, the stops that smart money hunts. Price is often drawn to these pools before reversing, the classic stop-run.

Knowing where liquidity sits tells you where price is likely to go and where reversals tend to begin, right after a sweep.

A liquidity sweep followed by a change of character is one of the highest-probability ICT entries. Watch for both together.
4TL ICT order blocks and fair value gaps
03 · ENTRIES

Order Blocks & Fair Value Gaps

The indicator auto-detects order blocks, the last candle before a strong move, and fair value gaps, the imbalances left behind in price. These are your precision entry zones.

When price retraces back into an order block or FVG that lines up with your bias, that is your entry trigger with tight, logical risk.

Stack confluence: structure in your favor, a liquidity sweep, then an entry from an order block or FVG. The more that align, the better.
4TL ICT SMT divergence and killzones
04 · TIMING & CONFIRMATION

SMT Divergence & Killzones

SMT divergence compares correlated markets (like NQ and ES) and flags when one makes a high or low the other fails to confirm, one of the highest-conviction tells in the model. Killzones shade the high-probability session windows where the real moves happen.

Together they tell you when to be active and give you an extra layer of confirmation before you commit.

Focus your trading inside the killzones. An SMT divergence during a killzone, at a liquidity level, is a textbook high-probability setup.

Putting it together

1

Set your bias

Read market structure. Trade with it until a CHoCH says otherwise.

2

Mark the liquidity

Find the pools price is likely to hunt above highs and below lows.

3

Wait for the killzone

Be most active inside the session windows the indicator shades.

4

Enter on confluence

Sweep + CHoCH + order block or FVG, ideally with SMT confirming.

Want the full ICT model? 35% off your first month with code SUMMER26.
Get the ICT